
Laura Singletary
Investigation #1: Problems and explorations with graphing functions and relations.
Problem #9: Investigate the graph of
![]()
For this investigation, I need to explore the variations of the graph of
![]()
when n = 2, 3, 4, ..., 24, 25.
I began my investigation by looking at the first four specificed values for n, where n = 2, 3, 4, and 5. One should expect to see a circle when n = 2, more specifically, a circle centered around the origin with a radius at 1. After using Graphing Calculator, we see that when n=3, the graph is a curve that passes through (0,1) and (1, 0). When n = 4, it looks like a square centered at the origin with rounded vertices and side length approximately 2 units, note it passes through (0,1), (1, 0), (-1, 0), and (0, -1). When n=5, the graph looks similar to the graph when n = 3, however the curve seems a bit more pronounced.
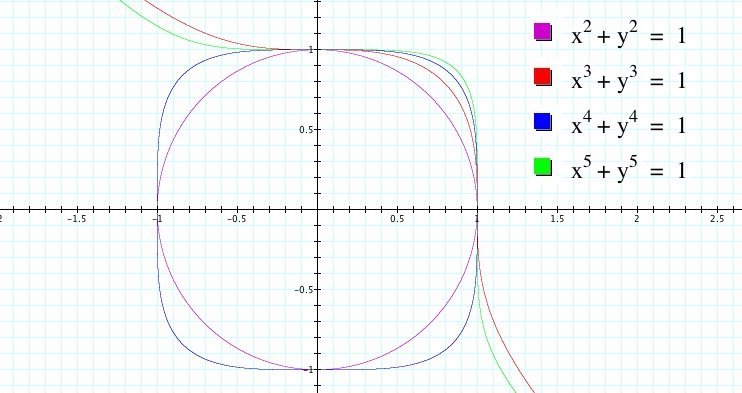
Therefore, some patterns seem to be evident within these first four graphs, for the patterns seem to exist between the even functions and between the odd functions. Before stating a hypothesis, I will investigate a few more even functions to see if the pattern continues.
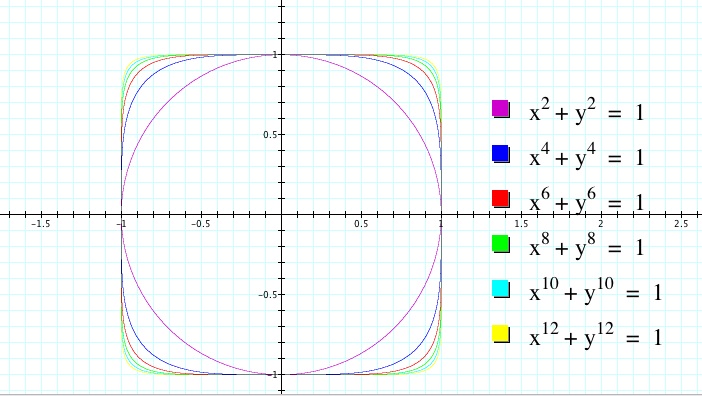
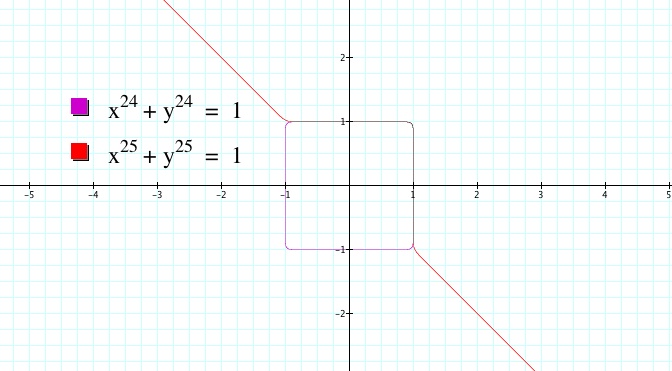
The graphs of the even functions above seem to suggest that when n is even, as n approaches infinity, what was originally a circle will become a square. Therefore when n=24, I would expect the graph of the function to resemble a square, with a center at the origin and a side length of approximately 2 units.
Additionally, a pattern seems to present itself within the odd functions in the first four graphs. Before stating a hypothesis, I will investigate a few more even functions to see if the pattern continues.
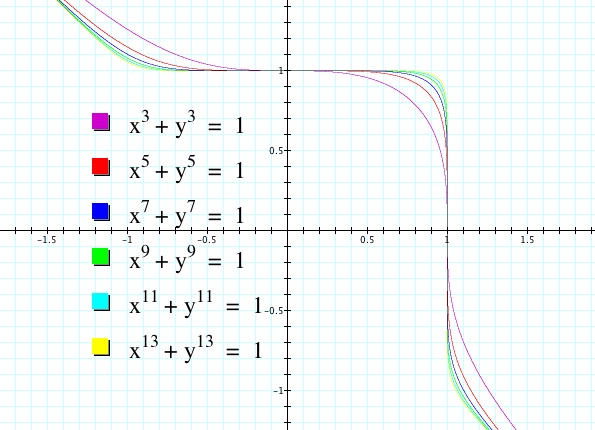
The graph of the odd functions show what looks like the graph of y = -x, with one exception - a type of curvature for values of x when 0 < x < 1. As n becomes large, the curvature becomes more sharp and the graph between 0 < x < 1 begins to resemble the corner of a square. Therefore, when n = 25, , I would expect the graph of the function to resemble a corner of a square when x is between 0 and 1.
Thus, I decided to graph the function when n = 24 and when n = 25 to evaluate my conjecture.
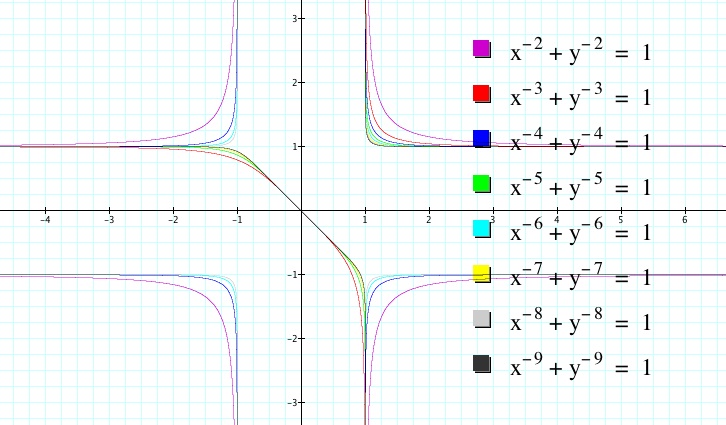
An additional exploration. During my investigation, I became curious as to what might happen to the graphs of this function when n was allowed to be a negative integer. Using Graphing Calculator, I explored this curiousity for n = -2, -3, ..., -9. The results are below.
Similarly, other extensions to this investigation may be added for a mathematically inquisitive student to explore.
1. What might happen when the exponents are not restricted to the natural numbers greater than or equal to 2? What if you allow n to become rational number greater than or equal to 2?
2. What happens if n grows infinitely large?